| Contents | Transport layer | Packet format | Application Protocol | Let's write a server |
Following along
I'd highly recommend following along with the details on these pages yourself. While my aim is to document as much as I can to the best of my ability, there will be things I miss, get wrong, or that are out-right newer than these pages! Knowing where the information here came from is key to being able to reproduce the findings yourself. It's also just generally quite fun, and a useful skill.
With that out of the way, you might then ask how to follow along. We're going to be getting nitty and gritty with some games, bemani specifically, so the very first step is to get your hands on one of those. Because we're going to want to poke around, we need a version of the game running on our PC (or in a VM), rather than on a cabinet. If you feel like starting with a real cabinet, mon has a great blog post about that.
The majority of direct references to code are based on Sound Voltex 4. The specific build I'm using in most snippets is KFC-2019020600; no need to be on private websites to be able to make use of that information.
Depending on what you have, you may be staring at a working game at this point, or a big network error. Either way, you're sorted.
Static vs dynamic analysis
Quick detour here. In reverse engineering (what we're doing!) you'll often hear these two terms used.
Static analysis is when we have a copy of the content, be that custom file formats, executable files, you name it, and we aim to identify how they work without running them. This can be very powerful, as it allows us to reverse engineer things we either can't or don't want to run. For example, we can perform static analysis of any program on a modern desktop PC, even a program written for an old games console. If you're sat staring at a network error right now, that's also a great example of the sorts of problems static analysis allows us to work around.
Dynamic analysis, as you may now have guessed, is when we start the program in question, and poke around while it's running. This poking can vary wildly; you might be curious about the values in memory during the execution of a function identified during static analysis, maybe you want to look at network traffic being created while the program runs, or maybe you just want to use the program normally to understand how it's intended to function.
We're going to be doing a lot of both, so strap in!
Setting up our workspace
There are a few essential tools every reverse engineer should have in their toolbox:
- A disassembler
- A hex editor
- A debugger
- A decompiler (incredibly useful but not essential)
I'm going to be using:
- Ghidra: Disassembler and decompiler
- IDA: Decompiler (for a second opinion; the decompiler isn't in the free version)
- FlexHex: Hex editor (there are so many free options here, so shop around)
- Visual Studio: Debugger
- Wireshark: Network captures
(Ghidra has a debugger now, but I'm yet to play around with it enough to ditch VS)
Setting up Ghidra
When you start Ghidra for the very first time, you will be presented with an empty screen. You'll need to create a new project; the name and location aren't especially important, but try and keep them sensible. After that, you can drag a file (libavs-win32.dll from your game is a good choice here) into the window. It will ask a series of questions; just acccept the defaults for everything. Once it's loaded, double click on the file to open the code browser. You will be asked if you would like Ghidra to automatically analise the file for you. Yes!
The interface can be pretty intimiading to start with, but there are a few important parts to note. Your window likely looks different to mine here, but the general layout will be roughly the same.
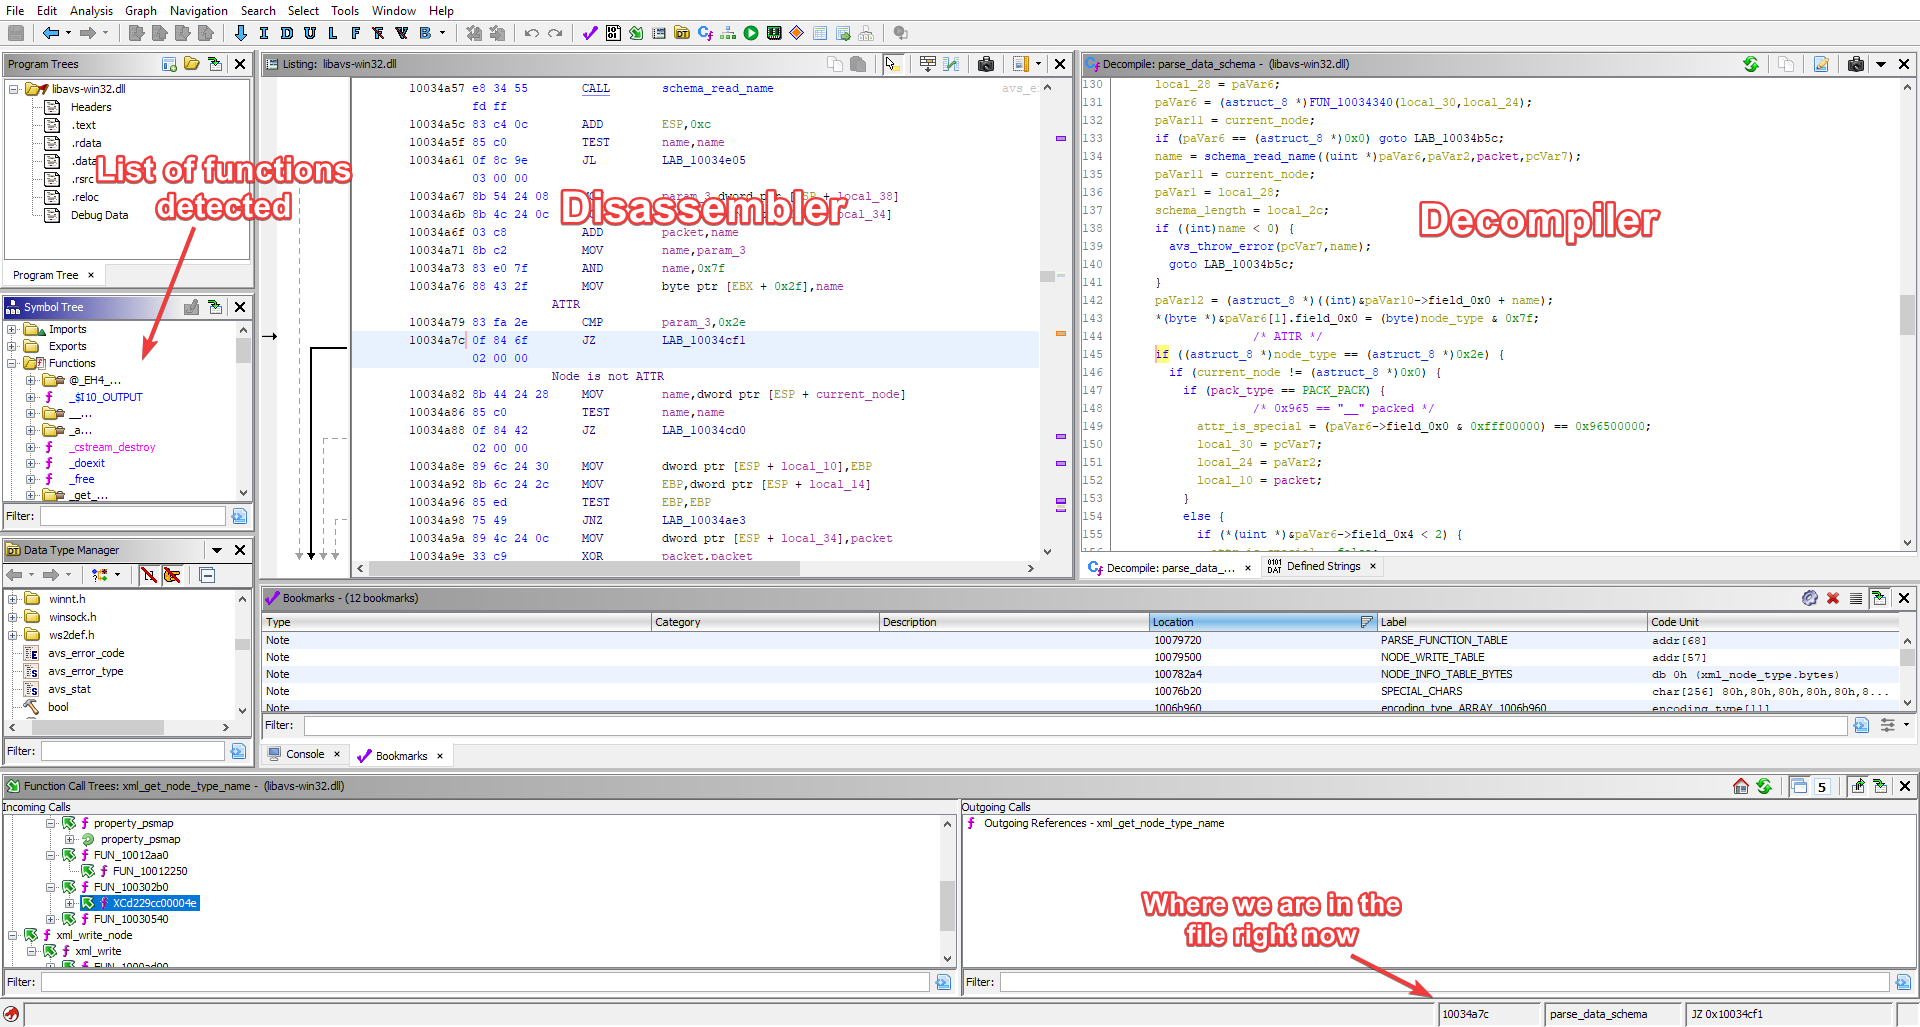
Everything in the interface is a draggable window, and can be popped out of the main window, so don't be afraid to move things around if that helps. For example, I added the bookmarks window below my disassembler and decompiler, because I use it quite frequently.
Key things to know in Ghidra:
- Double click on any label, function, or address to jump to that item. Alt+left and alt+right navigate through your location history.
- Middle click on any item to highligh all occurances of it (can be rebound to left click if you prefer it as default)
Lwill rename the item the cursor is over, andCtrl+Lwill change the type of the item (in the decompiler).Gwill open the jump popup. You can type an address, function name, label, etc. hereSto open search. If at first you aren't seeing results, you may need to switch to searchingAll Blocks.- There are a bunch of useful tools in the
Windowdropdown at the top! Have a play around; you can't break anything. ;allows you to add a comment to any line- In the disassembly:
Tto change the type of the data at the cursor,Dto disassemble at the cursor,Fto create a function at the cursor,Delto delete a function, andCto clear the selected data, returning it back to unknown bytes.
Setting up Wireshark
While less conventional as a dynamic analysis tool, Wireshark is an invaluable tool when working with network-related tasks.
Either by editing prop/ea3-config.xml, or using spicecfg, pick a totally bogus service URL, with a
distinct port. I'm going to use http://127.0.0.1:54321. Now start Wireshark, click once on the "adapter
for loopback traffic capture", then in the capture filter enter port 54321 (edit as required). Hit
enter, and you'll start capturing. When you now start the game, some things will pop up but because we didn't have
anything listening on that port (hopefully!) every attempt at communication was an error.
To rememdy this, let's run something on that port! It can be quite literally anything. nc -lvp 54321
will do, if you have netcat. With wireshark still running, restart the game. This time something interesting should
appear! If all went to plan, a green HTTP packet should show up.

Clicking on it, we can see additional details. If we expand the blue HTTP section, and then the Data
section at the bottom of that, we can view the raw data that was included in this HTTP POST request.
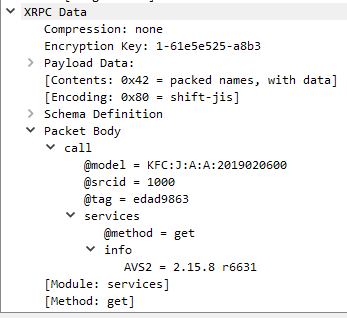
Wireshark is surprisingly flexible. Notice how in my screenshot the packet was identified as XRPC? I
wrote a relatively simple protocol dissector, which allows me to view the contents of XRPC packets directly within
Wireshark. While I might share it if I clean it up, it only took an hour or so in an evening to write; my aim is
that these documents provide everything you could ever need to be able to quickly write your own too.
Setting up Visual Studio
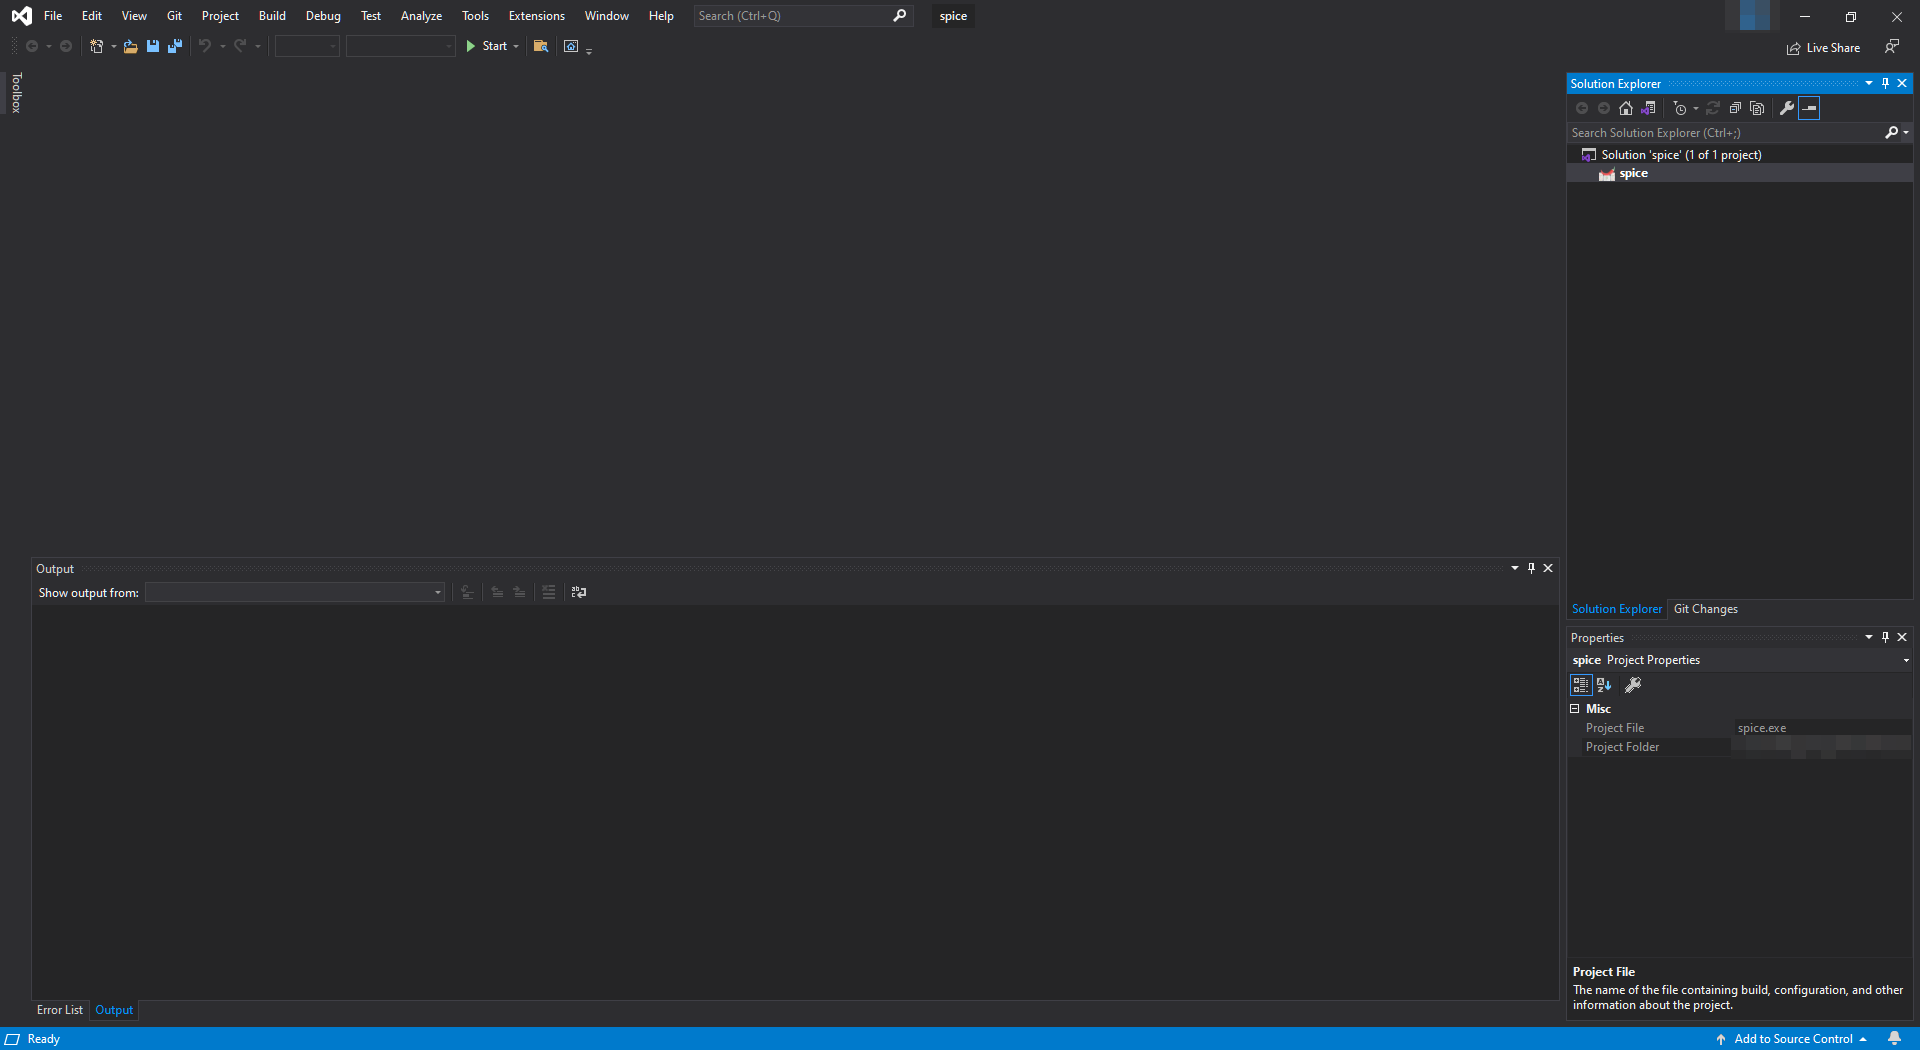
Saved the worst for last, I'm afraid. Once visual studio starts, drag the exe you use to start the game into it. Odds
are this is spice.exe. Visual Studio, in stark contrast to Ghidra, is totally barren.
When you press the start button, VS will likely ask you to restart it in elevated mode; go ahead and do that.
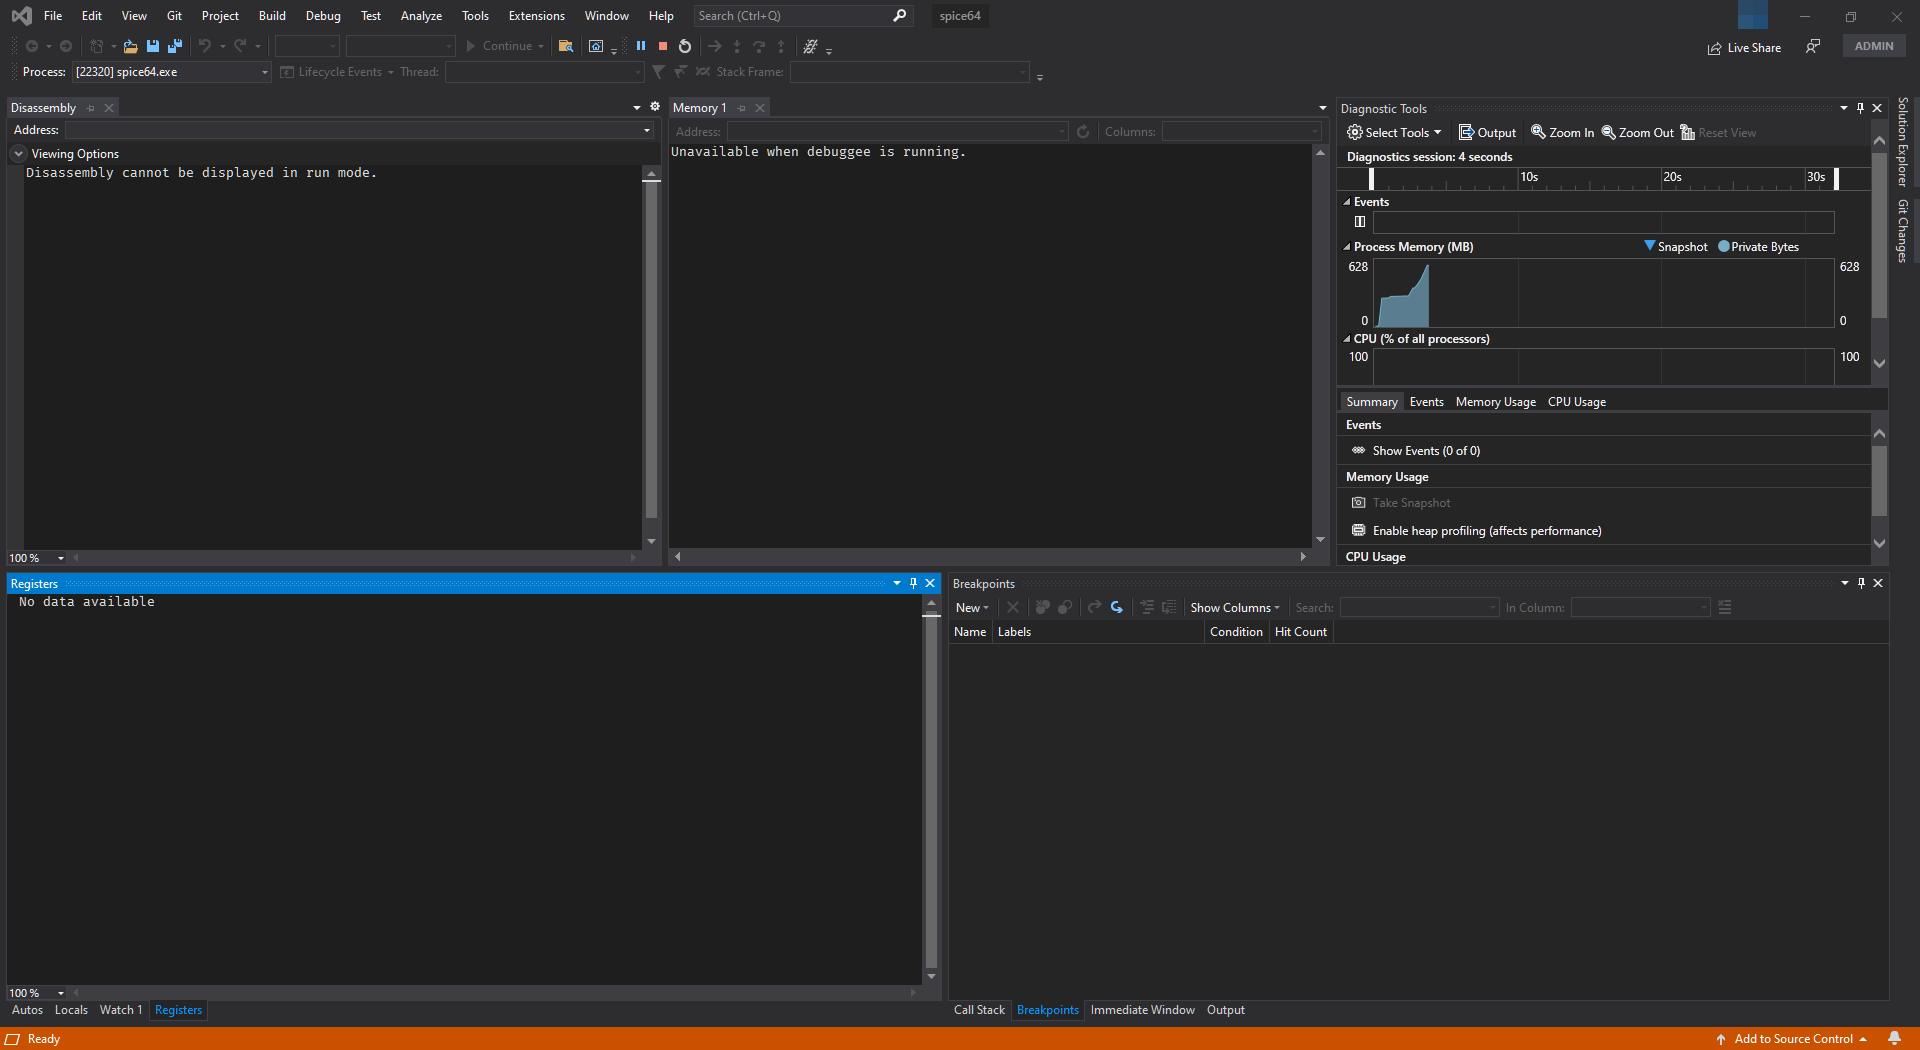
Wow. That's a lot more stuff, but it all seems a bit empty? As a debugger, VS only allows you to poke around while the program is paused. We can manually pause using the pause icon at the top, which would normally be sufficient. Unforunately, in our case, we're looking at a far bigger project. Odds are when you pause the program you will get a message that it's running "external" code, or you end up somewhere totally random.
To solve this, we can setup VS to automatically pause for us.
Debug -> New Breakpoint -> Function Breakpoint is the option we use to do this. VS will then
allow us to enter a... function name? Aah. The expectation being made here is that we are debugging our own program,
and have the full source code. Thankfully, we can instead enter an address here, by prefixing its address with
0x. This is where both static and dynamic analysis work together.
If you run the program again now (stop it if it's still running) Visual Studio will know to automatically pau- not so fast. The addresses we can see listed in Ghidra are the addresses we would expect, if the program was being loaded into memory at its "normal" location. Unfortunately for us, that can make genuinely malicious code easier, so a system called ASLR is used to randomise the addresses the program will use. This reallly sucks for dynamic analysis.
Thankfully, we don't need to turn it off for our whole computer. We're going to use a tool called PE Tools. After starting the program, drag the DLL we're curious
about onto it, libavs-win32.dll, for example. We need to lie to Windows that this DLL is not
actually able to handle having its addresses randomised, which involves turning off DLL can move. This
is going to directly edit the DLL file, so if you happen to be seeding it, consider this your warning to copy
everything over to a different folder before continuing.
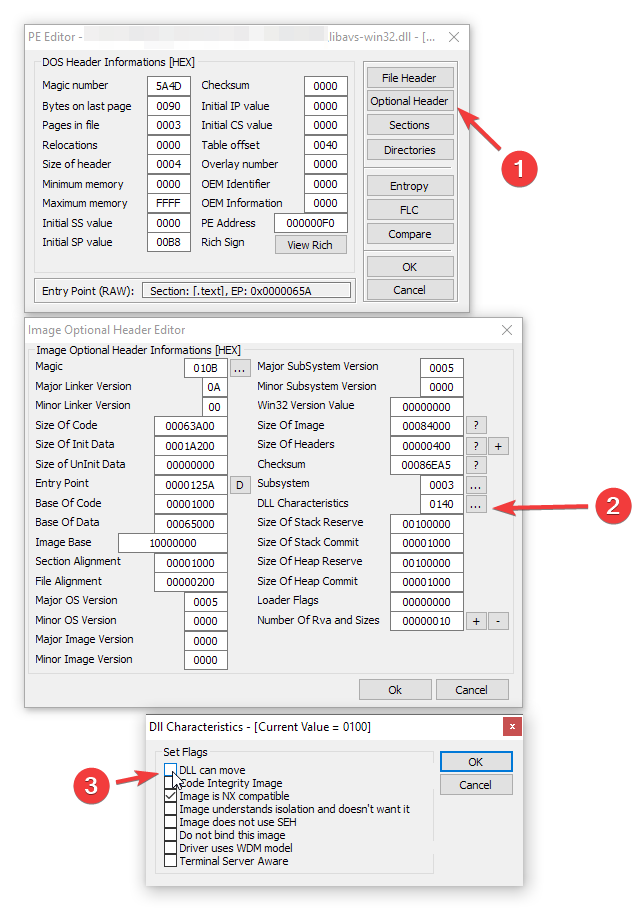
At this point, we can return to Visual Studio and add our breakpoint as previously. If you've been following along,
0x1000A920 is a good breakpoint to test. It's quite likely however that the breakpoint won't be hit.
This is, to the best of my knowledge, an issue in VS. Delete the breakpoint, and this time start the program then
hit the pause button immediatly. Only once paused, re-add the breakpoint, then continue execution.
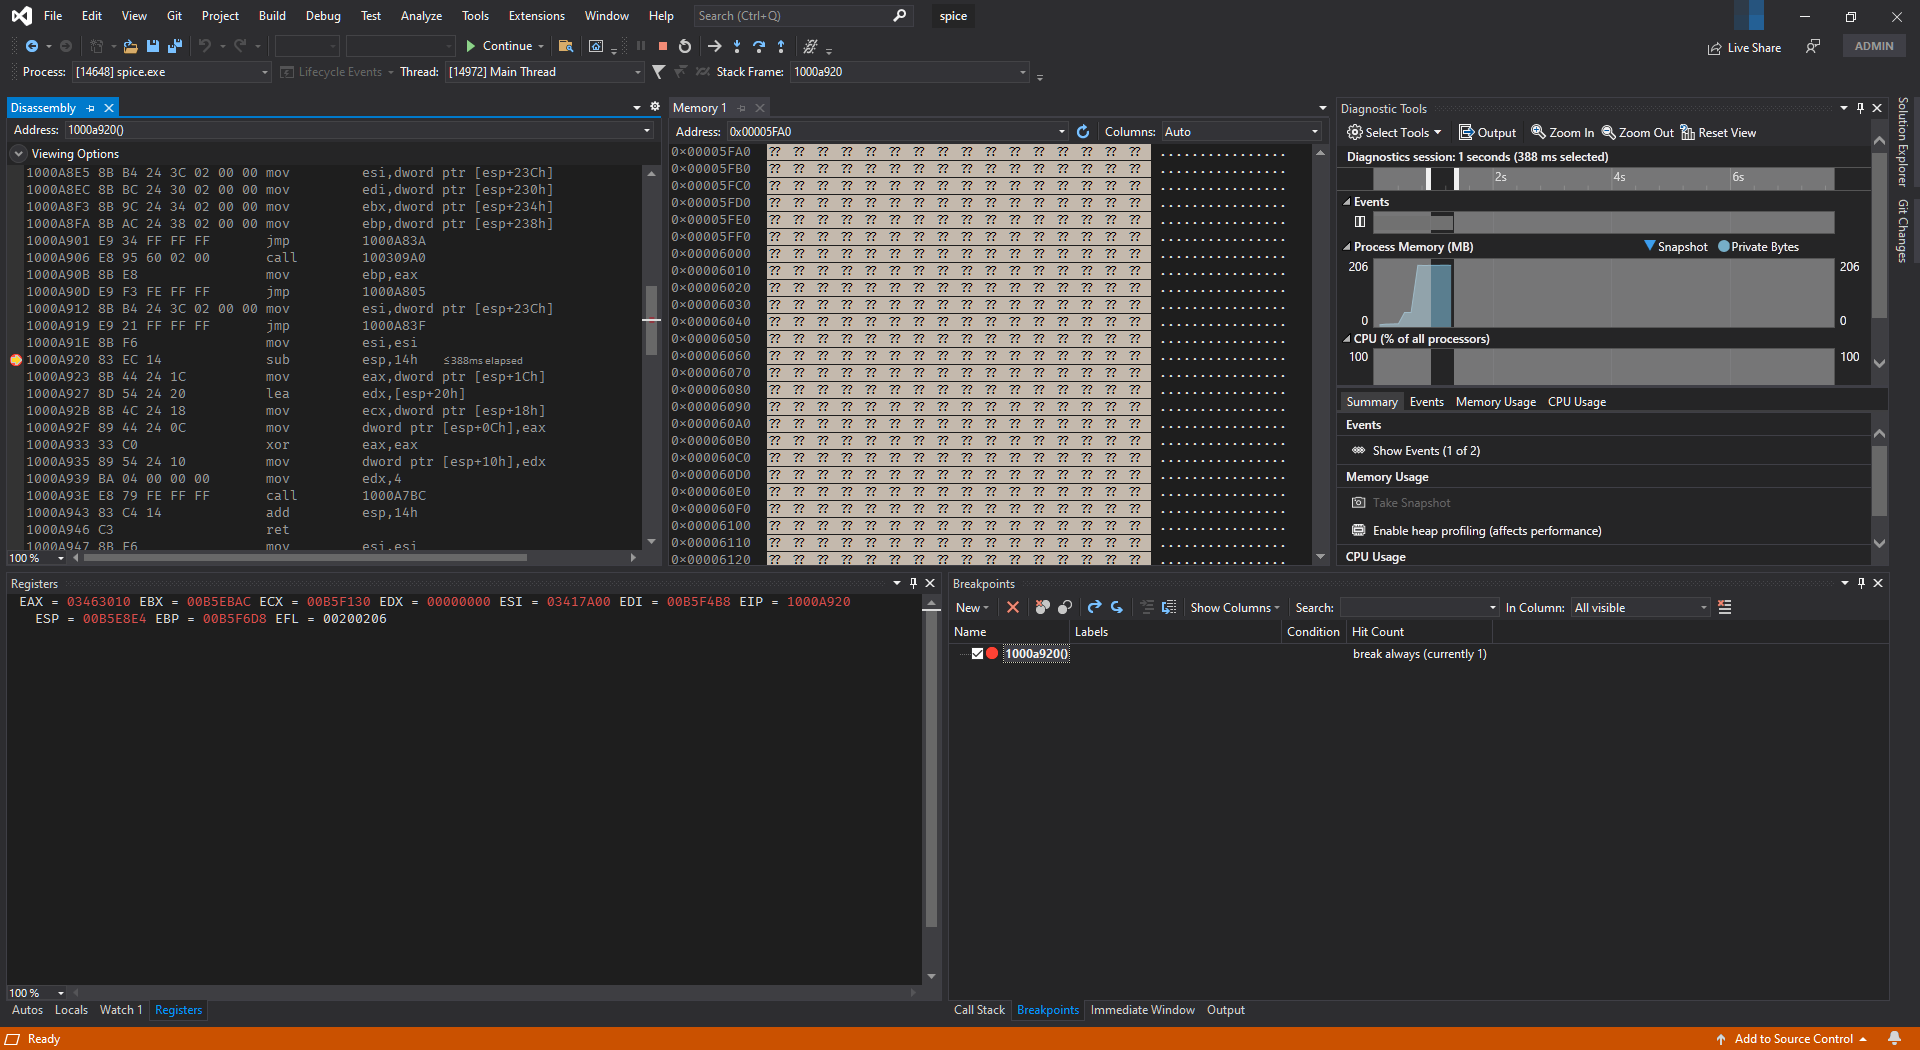
The breakpoint should be hit almost right away. This is because that address is one of the logging functions :). In
the bottom left, a list of registers are shown. This particular function takes its values via the stack, so paste
the ESP register's value into the address box of the memory viewer. Right clicking, we can switch to
4-byte mode, and can now see the stack clearly. The second number you see (ESP+0x04) is, in this case,
the first argument to the function. Jumping to that value, we can see what it was about to log. In my case it was
simply ea3-boot, but expect it to be different for you.